Advanced Auger Analysis
Technique Overview
The Auger parameter is a powerful tool for chemical analysis due to its sensitivity to the local chemical environment, its independence from charging, and its ability to provide insights into both initial- and final-state effects. The use of Auger parameters and Wagner plots can significantly enhance the information obtained from XPS measurements.
Applications and Fields
- Analyzing metal-ligand bonding
- Determining the surface stoichiometry of thin films
- Characterizing catalysts and interfaces
- Studying the effect of crystallinity and adsorption
- Analyzing free atoms, elemental solids, and atoms in molecules
- Investigating the electronic properties of clusters on different supports
- Identifying different coordination environments in materials
There are several types of relaxation energies:
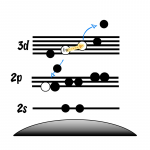
- Atomic or Intra-atomic Relaxation Energy: This type of relaxation is due to the rearrangement of the core and valence electronic levels of the photoemitter atom.
-
- It can be further divided into contributions from core electrons and valence electrons.
- The core electron contribution is usually constant, while the valence electron contribution depends on the chemical environment.
- Intra-atomic relaxation energy is the energy gained due to the electrons in the remaining atomic shells relaxing as a photoelectron leaves.
- Extra-atomic Relaxation Energy: This energy arises from the polarization of neighbouring atoms or molecules in the system in response to the core hole.
-
- It is caused by the sudden production of a positive charge within the crystal lattice where the photoexcited atom is located, which provokes a rearrangement of the electron density around it.
- This energy depends on the polarizability of the surrounding atoms and the distance between them and the core-ionized atom.
- Extra-atomic relaxation is also called polarization energy.
- Total Relaxation Energy: The sum of all contributions from the different relaxation processes. It is generally expressed as:
-
- R(C) = Ra(core electrons) + Ra(valence electrons) + Rea(extra-atomic contribution).
- The use of Hartree-Fock orbital energies and relaxation energy corrections to calculate extra-atomic relaxation.(1)
- The polarization potential model.(3)
- The equivalent core approximation (Z+1 approximation), where the core-ionized atom is approximated by the next element in the periodic table.(7)
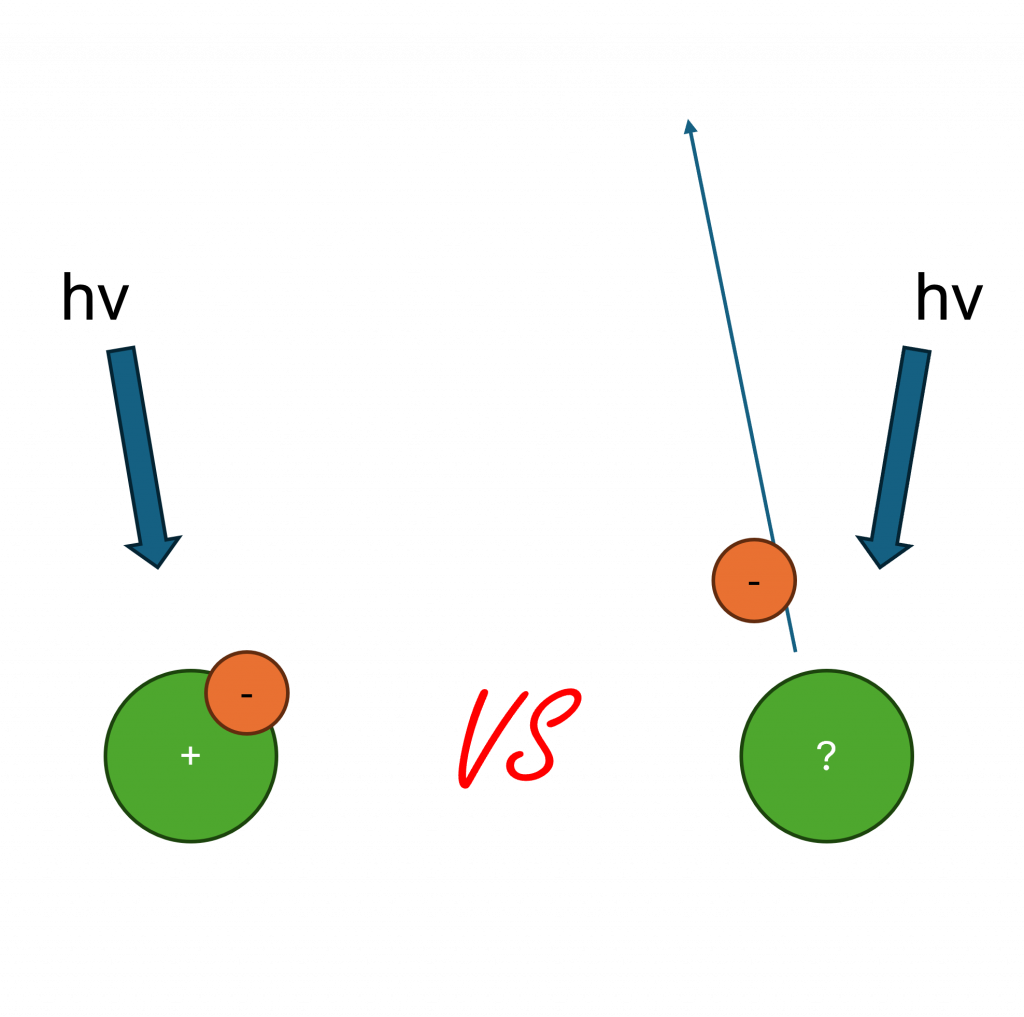
Thinking of a simple photoionization process as:
hv + Z ⇒ Z+ + e–
The energy of the photon is equal to the ionization energy of the atom plus the kinetic energy of the photon, we know this from our photoelectric effect fundamentals.
The energy of Z+ above the ground state is the ‘binding energy’
EB(Z+) = hv – E(e–)
According to Koopmans theorum, the binding energy is equal to the energy of the emitting electron shell in the ground state, as determined by Hartree-Fock calculation.
One effect that affects this relationship greatly, is the atomic relaxation – or rearrangement – energy.
Koopmans theorum falls slightly in this aspect, since it is a frozen orbital approximation, and therefore ignores the relaxation effects that follow photoemission.
This relaxation energy is approximately 75-85% of the square root of the final energy of the ion (in eV, calculated by Gelius1)
A close approximation of the EB of an isolated atom (referenced to the vacuum level) is:
- EBV(PEa) = ε – R
ε = ground state energy
a = isolated atom
PE = photoelectron
R = relaxation energy (atomic or intra-atomic)
The same atom in a molecule (gas) can experience 2 additional effects pertaining to binding energy
1.Bonding to neighbouring atoms will change the atomic energy levels in the ground state by ∆ε
2.Electrons from neighbouring atoms can relax during ionisation to reduce total energy
- EBV(PEm) = εa + ∆εm – R – Rmea
ε = ground state energy
a = isolated atom
m = isolated molecule
PE = photoelectron
R = relaxation energy (atomic or intra-atomic – assumed to not change significantly)
Rea = Relaxation energy / polarisation energy (extra-atomic)
Rea is the relaxation energy (or polarising energy) involving electrons from neighbouring atoms
So we can think of a chemical shift between atom and molecule as:
- EBV(PEa→m) = ∆εm – Rmea
Finally we consider the chemical shift in moving an isolated atom into the conductive state
Again, we do not expect a significant shift in R, and ∆εc is expected to be relatively small compared to Rcea
- EBV(PEa→c) = ∆εc – Rcea
ε = ground state energy
a = isolated atom
c = conductive atom in the solid state
PE = photoelectron
R = relaxation energy (atomic or intra-atomic – assumed to not change significantly)
Rea = Relaxation energy / polarisation energy (extra-atomic)
In a conductor, we expect Rcea to be related to the ionic charge (e), minimum electron screening distance (r) and dielectric constant (k) by:
Rcea = e2/2r (1 – 1/k)
From here we can see that relaxation energies may be influenced by ionic radius, with smaller ions imparting larger effects
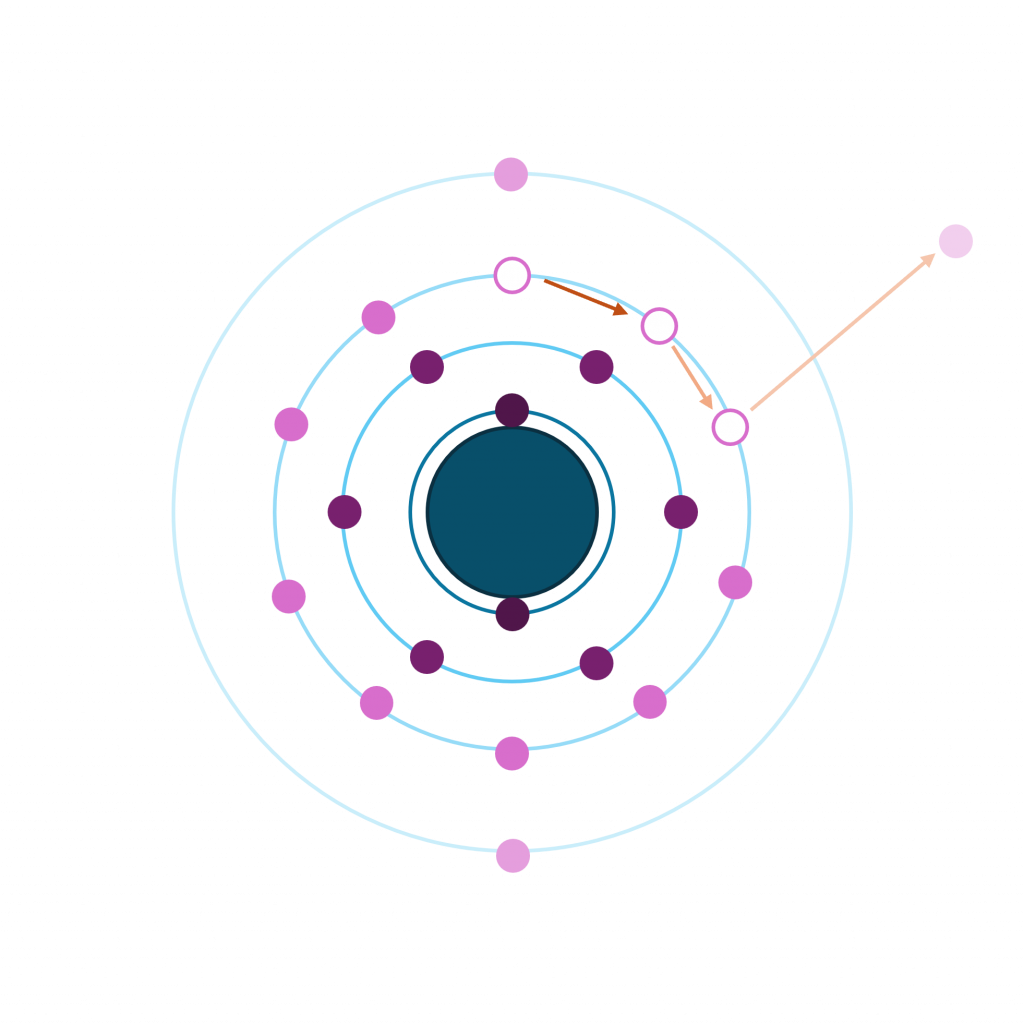
Auger KE is the difference between the energies of the initial and final state (note we are discussing here core-type Augers, where the double hole final state vacancies are in core levels only)
For a KLL auger
EV(Augera) = EBV(K+) – 2EBV(L+) + RS – F(x)
EBV(K+) = binding energy of K core electron (photoelectron)
EBV(L+) = binding energy of L core electron
RS = intra-atomic ‘static’ relaxation energy for the L shell
F(x) = electron-electron interaction term required due to the double vacancy in the final state
If we expand this to orbital energies and interatomic relaxation energies we have:
EV(Augera) = ε(K) – R(K+) – 2 ε(L) – 2R(L+) + RS – F(x)
Meaning in terms of shifts when an atom is in a molecule (gas) we have:
EV(Augera→m) = ∆EmV(K) – 2Em(L) + Rmea(L+L+) – Rmea(K+)
Shirley, D. A. “Theory of KLL Auger energies including static relaxation.” Physical Review A7.5 (1973): 1520.
EV(Augera→m) = kinetic energy shift of atomic state into molecular state
ε(K) = ground state energy of K shell
ε(L) = ground state energy of L shell
R(K+) = relaxation energy for the ionised K shell
R(L+) = relaxation energy for the ionised L shell
RS = intra-atomic ‘static’ relaxation energy for the L shell
F(x) = electron-electron interaction term required due to the double vacancy in the final state
Since the actual chemical shifts in different shells are experimentally quite close, we can simplify this equation to the below approximation:
EV(Augera→m) = -∆εm(L) + Rmea(L+L+) – Rmea(K+)
Conducting solids
For conductive solids, again – our chemical shifts in the ground state are minimal, so we expect the chemical shift to be dominated by the relaxation energy terms
Rcea =e2/2r (1 – 1/k)
EV(Augera→c) = -∆εc(L) + 3/4Rcea(L+L+)
EV(Augera→c) = -∆εc(L) + 3Rcea(K+)
EV(Augera→c) = kinetic energy shift of atomic state into conducting solid state
RS(LL) = intra-atomic ‘static’ relaxation energy for the L shell
RT(LL) = total two-hole relaxation energy
RD(L) = one-hole dynamic relaxation energy
RS(LL) = RT(LL) – 2 RD(L)
This parameter describes the additional relaxational shift of the total energy for a two-hole system relative to two isolated holes
This is dominated by Coulomb interactions and we have:
RT(LL) = 4 RD(L)
The Auger parameter is defined as the difference between a photoelectron core line peak, and an auger peak
As such, it is free from any complications due to sample charging, or work functions – since this is a difference, they all cancel out
- α = EV(C’C’’C’’’) – EV(C)
Modified Auger parameter
This parameter was found to be very useful, but was inconsistent when comparing data between different photon energies.
In order to improve this, a shift towards using a new term – the modified auger parameter was adopted.
This uses PE core peak binding energy, instead of kinetic energy.
- α’ = EVB(C’C’’C’’’) + EVB(C) = EV(C’C’’C’’’) – EV(C) + hv
When referring to shifts (∆α or ∆α’), these are going to be identical whether we refer to the Auger, or the modified Auger, parameter.
For the purposes of this explanation, we will stick with the original term, however the shifts themselves are identical for both ∆α and ∆α’.
The chemical shift, from atom to molecule is:
∆aa→m = Rmea (L+L+) – Rmea (K+)
And from atom to conducting solid:
∆aa→c = Rcea (L+L+) – 2Rcea (K+)
Assuming Rmea (L+L+) – 4Rea (K+)
∆aa→c = ½Rcea (L+L+) = 2Rcea (K+)
From:
- EB(Z+) = hv – E(e–)
- EBV(PEa) = ε – R
- ∆ EV(Augera→m) = ∆εm(K) – 2 εm(L)+ Rmea (L+L+) – Rmea (K+)
- αa = 2ε(K) – 2ε(L) – 2R(K+) + 2R(L+) – hν – F(x) + RS
Now – going from a conducting solid, to an insulating materials:
- ∆αc→i = ½[Riea(L+L+) – Rcea(L+L+)] = 2[Riea(K+) – Rcea(K+) ]
If we then look at these -∆α values for a range of materials, we see that this auger shift scales with polarizability of the atom.
The more polarizable a species (i.e. the more covalency involved in it’s bonding) – the closer the -∆α value will be to 0 (i.e. the conductive solid state)
The change in modified auger parameter can be defined as
- ∆α’ = α’ (x) – α’ (s)
Where α’ (s) = the modified auger parameter of the element in it’s solid form.
And α’ (x) is the modified auger parameter of our sample in question.
Final State Effects: The Auger parameter is primarily sensitive to final-state effects, which arise from the relaxation of the electron cloud after core ionization.(3) These effects are related to the ability of the environment to screen the core hole.(8) The change in the Auger parameter (Δα) is directly related to changes in the extra-atomic relaxation energy (ΔR), with Δα ≈ 2ΔR.(1)
Specifically, the Auger parameter shift with respect to the free atom is related only to final state effects and the ground state valence charge (as discussed in the above maths section).
Initial State Effects: Initial state effects are related to the ground state charge distribution of an atom before core ionization.
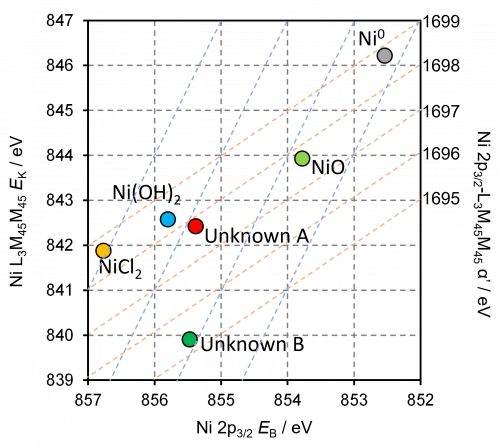
In a Wagner plot, compounds that exhibit similar initial state effects will fall on a line with a slope of approximately 3. These shifts reflect the nature of the chemical bonds and the local potential at the core-ionized atom.
Initial state effects can be estimated from the shifts in the core-level eigenvalues.
Deconvolution Process
Experimental Measurement: Obtain the kinetic energy of a core-core-core Auger transition and the binding energy of a core electron for the same element using XPS. These values should be measured under the same experimental conditions.
Calculate Auger Parameter: Calculate the Auger parameter using α = Ek + Eb or α’ = Ek + Eb if the values are referenced to the Fermi level.(8)
Determine Shifts: Compare the Auger parameter values (and binding energies) for different chemical states.
Wagner Plot Analysis: Plot the Auger kinetic energy against the core-level binding energy for each chemical state.
Compounds with similar final-state relaxation energies will fall on a line with a slope of -1 (or +1, due to the reversed x-axis in the Wagner plot).
The intercept of this line with the ordinate is the Auger parameter, which is related to the final state relaxation energy. Shifts in the Auger parameter between different chemical states are related to changes in the final state relaxation energy.
Extract Final State Contributions: Changes in the Auger parameter (Δα) are directly related to changes in the final-state relaxation energy (ΔR). Δα ≈ 2ΔR.
The Auger parameter is used to directly measure the extra-atomic relaxation energy.
Estimate Initial State Contributions: Once the final state contribution (relaxation energy) is known, the initial state contribution (ΔV) to the core-level shift can be estimated using the relationship ΔEb = ΔV – ΔR or ΔEk = -ΔV + 3ΔR, where ΔEb is the binding energy shift, and ΔEk is the kinetic energy shift.
The initial state shift can be estimated by comparing measured core-level binding-energy shifts with calculated shifts based on core-level eigenvalue.
Theoretical Calculations: The initial and final state effects can be further studied with theoretical calculations.
Ab initio calculations, such as Hartree-Fock or Density Functional Theory (DFT), can provide detailed insights into the initial and final state contributions to the binding energy. These methods can also be used to predict the surface segregation of an element in an alloy.
Additional Considerations:
Core-level Selection: The specific core levels and Auger transitions chosen for analysis can affect the accuracy of the separation.
For example, in systems with high lattice strain, when Auger transitions involve states with high-lying d-holes, the Auger parameter analysis may not accurately represent the initial or final state contributions due to symmetry effects.(9)
Local vs Non-Local Screening: The Auger parameter can help differentiate between local and non-local screening mechanisms.(10)
In some compounds, the relaxation process is non-local, involving electron transfer from neighbouring ligands to the core-ionized atom.
Multiplet Splitting: The presence of unpaired electron spins can result in observable effects from exchange splitting. These are considered to be final-state contributions.(4)
Limitations
The accuracy of Auger parameter analysis depends on some approximations. For example, the assumption that the relaxation energy for a doubly core-ionized state created by the Auger process equals 2R may not always be valid.
For insulators and semiconductors, charging problems can affect the semi-quantitative analysis when using Wagner plots (since charge referencing errors can affect the position on the X/Y).(3)
Binding Energy Shifts:
Auger Parameter Shifts
As the size of metal nanoparticles decreases, the Auger parameter generally shifts to lower values compared to the bulk material. This shift indicates changes in the electronic environment, particularly in the screening of core holes (final state contributions).
The Auger parameter is very sensitive to the chemical nature of the nearest-neighbour ligands of the core-ionized atom
Local vs Non-Local Screening: The local screening mechanism involves electron transfer from the nearest-neighbour ligands into a localized atomic orbital of the core-ionized atom, while the non-local mechanism involves population of spatially extended s and p orbitals from ligand valence orbitals. For transition metal ions with localized d orbitals, the Auger parameter is relatively independent of the chemical nature of the ligands, while the Auger parameter is more sensitive to chemical nature of the ligands in the case of non-local screening.(16)
Quantifying Size and Shape (17)
The Auger parameter has been shown to correlate with the band gap of materials, particularly in semiconductors and oxides. This relationship arises because the Auger parameter reflects the electronic environment and polarization properties of a material, which are also related to the band gap.(18)
In small metal nanoparticles, charge transfer between the metal atoms and the support material or surface adsorbates can occur.(2,3) By analyzing the initial state contributions, it’s possible to determine how the electron density around the metal atoms is altered, which impacts their chemical and catalytic properties.(14)
Auger parameter is a useful tool for determining the surface basicity of metal oxides – in the same way as when comparing auger parameter shifts to base metals in the above methods, we can compare to that of gaseous H₂O (which has an α value of 1038.5 eV), where an increase in α indicates higher surface polarisability. This increase, along with a decrease in the separation of specific Auger transitions KLL – KLV (ΔEk), suggests that the surface has greater Lewis basicity.
For example, in the case of MgO nanoparticles, as the particle size increases, both α and ΔEk indicate an increase in surface base strength. This is due to the growth of crystallites and the transformation from regular (100) facets to more reactive stepped (110) facets. However, once the crystallites grow beyond 10 nm, further changes in morphology or surface termination are minimal, which is reflected in a plateau in their polarisability. This plateau suggests that the surface basicity does not increase further with additional crystallite growth.(21)

Fig. 1. (a) Representative deconvoluted O KLL Auger for MgO precursor, (b) variation of Auger parameter and ΔEk with MgO crystallite size and (c) Correlation of activity for tributyrin transesterification with methanol and Surface polarizability. Reproduced from (22) with permission from Elsevier (licence number 5941270016081).
Robin West and Jim Castle identified a correlation between the Al and Si auger parameters with refractive index of silicates.
The auger parameter was found to scale with the polarization energy of the surrounding oxygen ions, which were correlated with measured refractive indexes to identify a new method for identfying changes to RI using XPS.
- Wagner, C. D., and A. Joshi. “The auger parameter, its utility and advantages: a review.” Journal of electron spectroscopy and related phenomena 47 (1988): 283-313. Read it online here.
- Wagner, C. D. “Chemical shifts of Auger lines, and the Auger parameter.” Faraday Discussions of the Chemical Society 60 (1975): 291-300. Read it online here.
- Moretti, Giuliano. “Auger parameter and Wagner plot in the characterization of chemical states by X-ray photoelectron spectroscopy: a review.” Journal of electron spectroscopy and related phenomena 95.2-3 (1998): 95-144. Read it online here.
- Egelhoff Jr, W. F. “Core-level binding-energy shifts at surfaces and in solids.” Surface Science Reports 6.6-8 (1987): 253-415. Read it online here.
- Broughton, J. Q., and P. S. Bagus. “ΔSCF calculations of free atom—ion shifts.” Journal of Electron Spectroscopy and Related Phenomena 20.1 (1980): 127-148. Read it online here.
- Hohlneicher, George, Harald Pulm, and Hans-Joachim Freund. “On the separation of initial and final state effects in photoelectron spectroscopy using an extension of the auger-parameter concept.” Journal of electron spectroscopy and related phenomena 37.2 (1985): 209-224. Read it online here.
- Mejias, J. A., et al. “Interpretation of the binding energy and auger parameter shifts found by XPS for TiO2 supported on different surfaces.” The Journal of Physical Chemistry 100.40 (1996): 16255-16262. Read it online here.
- Moretti, Giuliano. “The Wagner plot and the Auger parameter as tools to separate initial-and final-state contributions in X-ray photoemission spectroscopy.” Surface science 618 (2013): 3-11. Read it online here.
- Bagus, Paul S., Andrzej Wieckowski, and Hajo Freund. “Initial and final state contributions to binding-energy shifts due to lattice strain: Validation of Auger parameter analyses.” Chemical physics letters 420.1-3 (2006): 42-46. Read it online here.
- Moretti, Giuliano, and Horst P. Beck. “Relationship between the Auger parameter and the ground state valence charge of the core‐ionized atom: The case of Cu (I) and Cu (II) compounds.” Surface and Interface Analysis 51.13 (2019): 1359-1370. Read it online here.
- Biesinger, Mark C., et al. “The role of the Auger parameter in XPS studies of nickel metal, halides and oxides.” Physical Chemistry Chemical Physics 14.7 (2012): 2434-2442. Read it online here.
- Bourque, Jeremy L., Mark C. Biesinger, and Kim M. Baines. “Chemical state determination of molecular gallium compounds using XPS.” Dalton Transactions 45.18 (2016): 7678-7696. Read it online here.
- Kaushik, Vijay Kumar. “XPS core level spectra and Auger parameters for some silver compounds.” Journal of Electron Spectroscopy and Related Phenomena 56.3 (1991): 273-277. Read it online here.
- Moretti, Giuliano, et al. “Auger parameter and Wagner plot studies of small copper clusters.” Surface Science 646 (2016): 298-305. Read it online here.
- Islam, Mohammed J., et al. “PdCu single atom alloys supported on alumina for the selective hydrogenation of furfural.” Applied Catalysis B: Environmental 299 (2021): 120652. Read it online here.
- Moretti, Giuliano. “The Auger parameter and the polarization energy: A simple electrostatic model.” Surface and Interface Analysis 16.1‐12 (1990): 159-162. Read it online here.
- Yubero, Francisco, et al. “Size and shape of supported zirconia nanoparticles determined by x-ray photoelectron spectroscopy.” Journal of applied physics 101.12 (2007). Read it online here.
- González-Elipe, Agustín R., and Francisco Yubero. “Spectroscopic characterization of oxide/oxide interfaces.” Handbook of surfaces and interfaces of materials 2.4 (2001): 147. Read it online here.
- Thøgersen, Annett, et al. “An experimental study of charge distribution in crystalline and amorphous Si nanoclusters in thin silica films.” Journal of Applied Physics 103.2 (2008). Read it online here.
- Pacchioni, Gianfranco, and Hans-Joachim Freund. “Controlling the charge state of supported nanoparticles in catalysis: lessons from model systems.” Chemical Society Reviews 47.22 (2018): 8474-8502. Read it online here.
- Montero, Janine M., et al. “Structure-sensitive biodiesel synthesis over MgO nanocrystals.” Green chemistry 11.2 (2009): 265-268. Read it online here.
- Montero, J. M., et al. “The surface chemistry of nanocrystalline MgO catalysts for FAME production: An in situ XPS study of H2O, CH3OH and CH3OAc adsorption.” Surface science 646 (2016): 170-178. Read it online here.
- West, R. H., and J. E. Castle. “The correlation of the auger parameter with refractive index: an XPS study of silicates using Zr Lα radiation.” Surface and Interface Analysis 4.2 (1982): 68-75. Read it online here.


