Oxygen
Doublet Separations
- No relevant non-S-orbital emissions
The Energies Listed are Binding Energies!
- O 1s: 530 eV
- O 2s: 20 eV
- O 2p: 8 eV
The Energies Listed are Binding Energies!
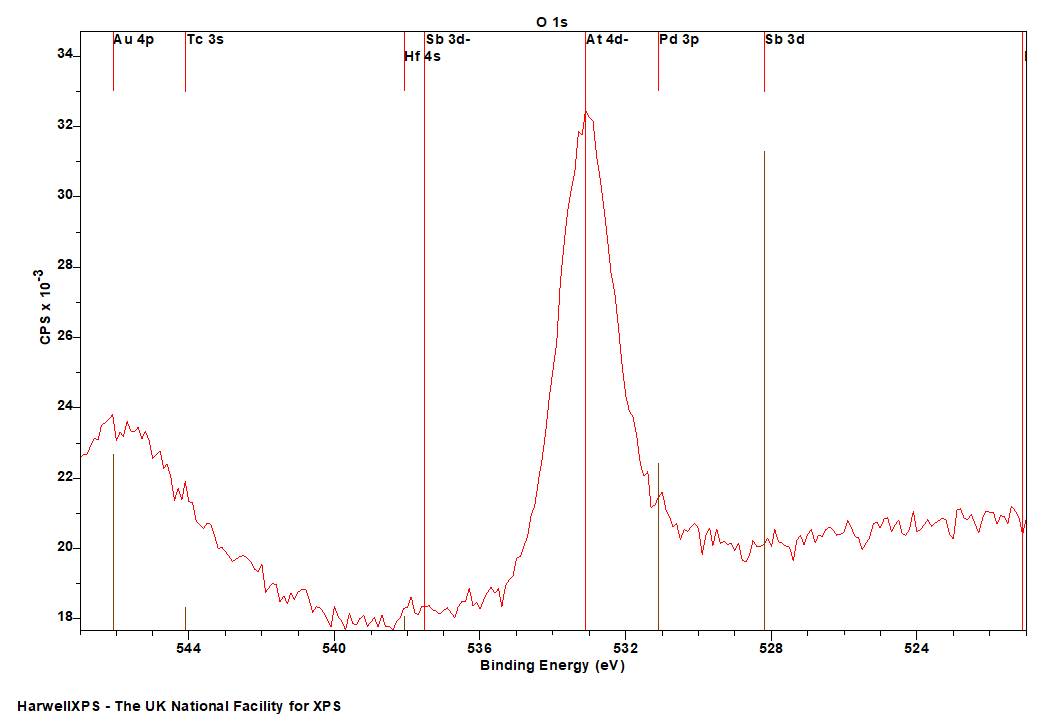
Overlaps for O 1s (primary emission)
- Na KLL (Al kα X-rays) (500 eV)
- V 2p (512 eV)
- Dy MNN (Al kα X-rays) (517 eV)
- Sb 3d (528 eV)
- Pd 3d (531 eV)
- At 4d (533 eV)
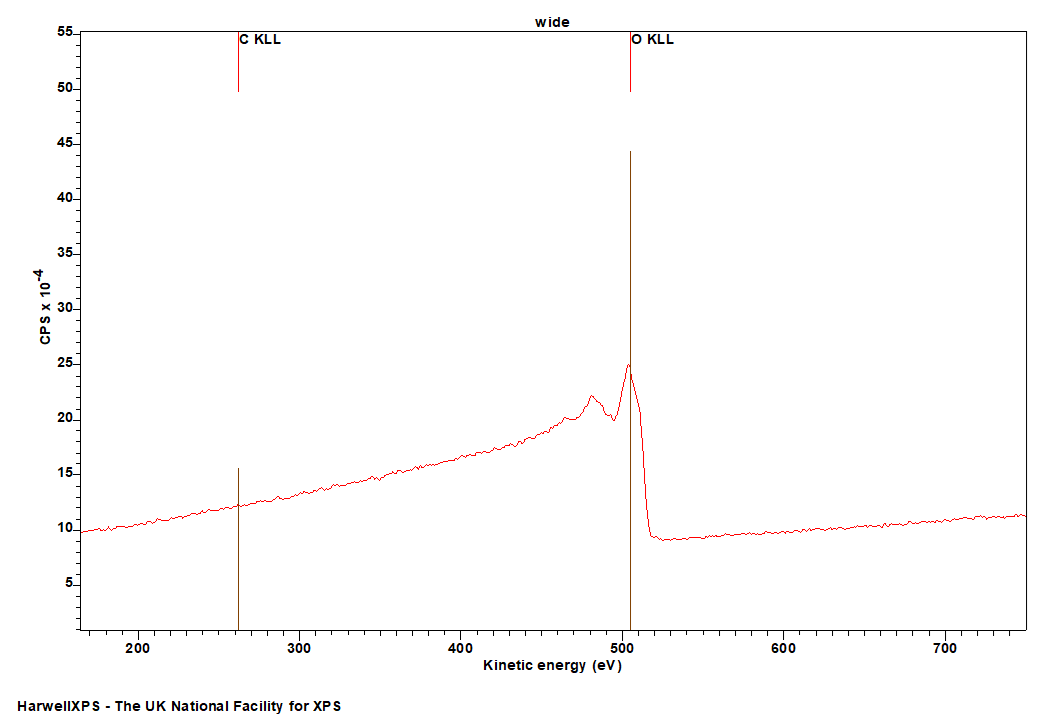
Energies listed are Kinetic Energies!
O KLL: ~ 505 eV
The Energies Listed are Binding Energies!
| Species | Binding energy range / eV |
| Metal Oxides | 529-531 |
| Metal Carbonates | 532-532 |
| Organic C-O | ~533 |
| Organic C=O | 531-532 |
| Hydroxyls/Hydroxides | 532-533 |
For a detailed list of metal oxide O 1s positions, check out our page on Oxygen (Metal Oxides) and Oxygen (Organics and Polymers)
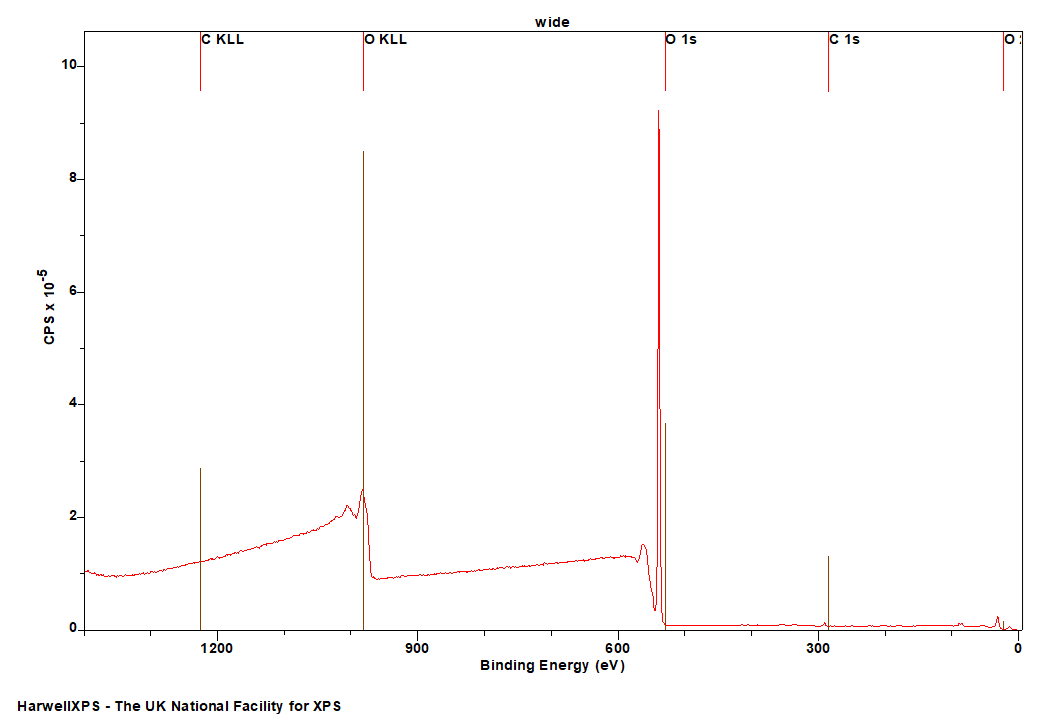
Oxygen is generally analysed using the O 1s region, which is a typical symmetric Gaussian with no particularly unusual features.
The O 1s core level is particularly significant in XPS analysis because it provides detailed information about the chemical states of oxygen atoms. The binding energy of the O 1s electrons varies depending on the specific chemical environment, allowing for the identification of different oxygen-containing species such as oxides, hydroxides, carbonates, and organic oxygen compounds. Accurate interpretation of the O 1s spectra requires careful consideration of factors such as sample preparation, charge neutralization, and peak fitting, as the O 1s region can be complex with overlapping peaks from different oxygen species.
.
If depth profiling metal oxides, be aware that aggressive ion etching treatments will preferentially remove oxygen. Collect the oxygen first for each scan.
Recording an extended range (~580 eV), permits recording of the O 1s loss feature, caused by inelastically scattered electrons – and may be used to measure material band gaps.
If a significant amount of sodium is present, be sure to record at energies up to around 540 eV, as a lower level Auger emission from the Na KLL transition will present as spectral intensity at the high binding energy side – which will need a larger range for correct background modelling.
Oxygen analysed in the presence of Na may result in confusion with some lower order signal intensity from the Na KLL Auger transition – appearing as high energy Oxygen. This may be particularly confusing if analysing O 1s species at very high BE (e.g. water in NAP-XPS), where the Na intensity may seem to be a shoulder of the main peak. 
Overlap between O 1s and Na KLL signal – note this Na KLL intensity may be mistaken for high energy O 1s features
Not available
Not available
References
- Data acquired by HarwellXPS
- Isaacs, Mark A. “Low temperature XPS of sensitive molecules: Titanium butoxide photoelectron spectra.” Applied Surface Science Advances 18 (2023): 100467. Read it online here.
- Isaacs, Mark A., Brunella Barbero, Lee J. Durndell, Anthony C. Hilton, Luca Olivi, Christopher MA Parlett, Karen Wilson, and Adam F. Lee. “Tunable silver-functionalized porous frameworks for antibacterial applications.” Antibiotics 7, no. 3 (2018): 55. Read it online here.
- Montero, Janine M., Pratibha Gai, Karen Wilson, and Adam F. Lee. “Structure-sensitive biodiesel synthesis over MgO nanocrystals.” Green chemistry 11, no. 2 (2009): 265-268. Read it online here.