
Molybdenum
Doublet Separations
- Mo 3d: 3.2 eV
- Mo 3p: 17.4 eV
- Mo 4p: 2.1 eV
The Energies Listed are Binding Energies!
- Mo 3s: 505 eV
- Mo 3p: 393 eV
- Mo 3d: 227 eV
- Mo 4s: 62 eV
- Mo 4p: 35 eV
- Mo 4d: 2 eV
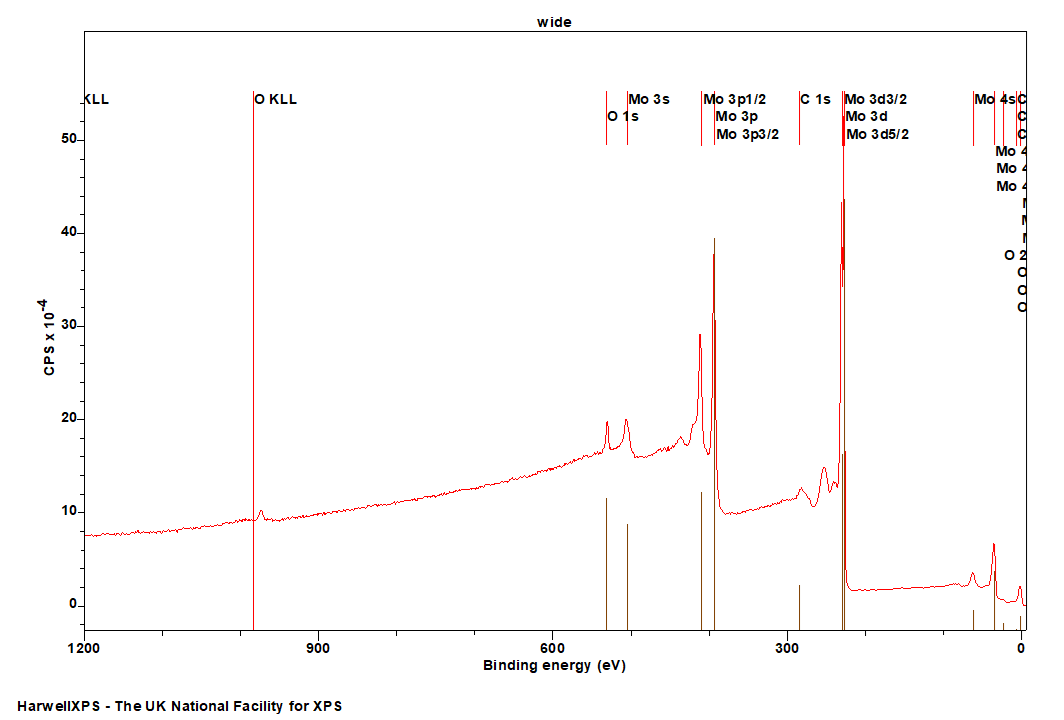
The Energies Listed are Binding Energies!
Mo is primarily analyzed via the 3d orbital
- Ce 4p (224 eV)
- Nd 4p (225 eV)
- S 2s (229 eV)
- Th 5p (229 eV)
- Ta 4d (230 eV)
- Cs 4s (231 eV)
- Se 3s (232 eV)
- Fr 5s (234 eV)
- Pm 4p (237 eV)
- Pr 4p (237 eV)
- Rn 4f (238 eV)
- Rb 3p (239 eV)
Energies listed are Kinetic Energies!
Mo MNN: ~ 186 eV
The Energies Listed are Binding Energies!
| Species | Binding energy / eV | Charge Ref | Ref |
| Mo(0) | 227 | Au 4f (83 eV) | 1 |
| Moδ+ | 228.7 | C 1s (284.8 eV) | 2 |
| MoO2 (Mo 4+) | 230.0 ± 0.1 | C 1s (284.8 eV) | 2 |
| Mo (5+) | 231.0 ± 0.1 | C 1s (284.8 eV) | 2 |
| MoO3 (Mo 6+) | 232.45 ± 0.15 | C 1s (284.8 eV) | 2 |
| MoCl3 | 229 | Au 4f (83 eV) | 1 |
| MoCl4 | 229.6 | Au 4f (83 eV) | 1 |
| MoCl5 | 230 | Au 4f (83 eV) | 1 |
| MoS2 | 228.1 | Au 4f (83 eV) | 1 |
| MoSe2 | 227.3 | Au 4f (83 eV) | 1 |
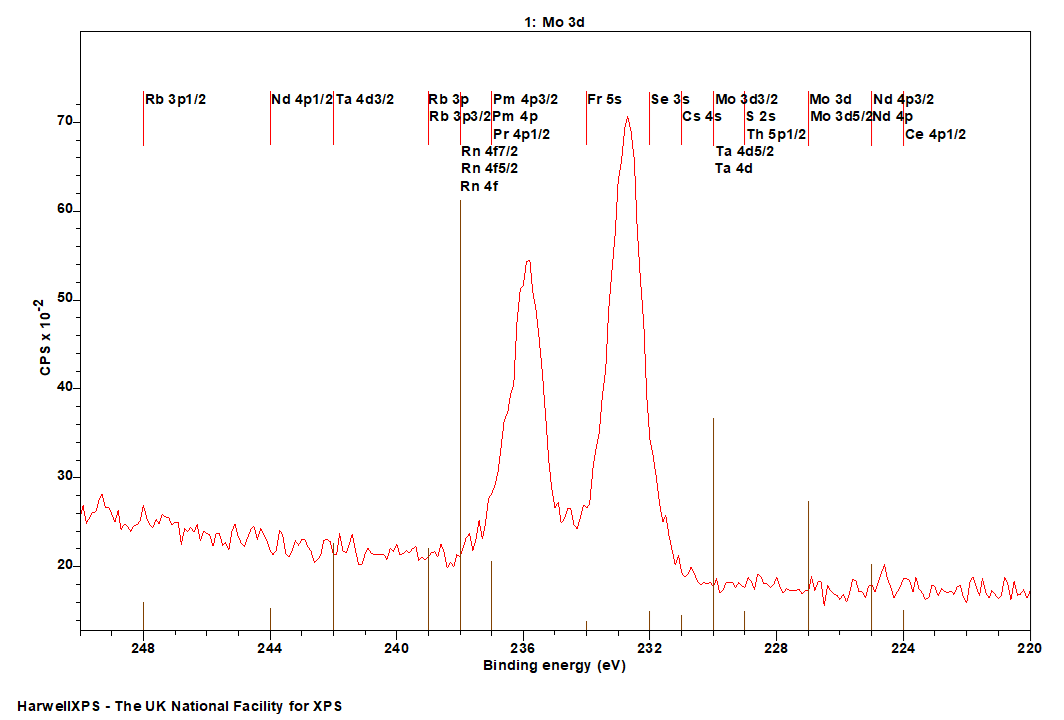
Molybdenum, a transition metal, exhibits various oxidation states, commonly Mo(0), Mo(IV), and Mo(VI), which can be distinguished by their unique binding energies in the XPS spectra. The Mo 3d core level is particularly significant, with the 3d5/2 and 3d3/2 peaks providing detailed information about the chemical state and environment of molybdenum atoms. For instance, Mo metal typically shows a binding energy around 228.0 eV for the Mo 3d5/2 peak, while MoO₂ and MoO₃ exhibit binding energies around 229.5 eV and 233.1 eV, respectively. The analysis of these peaks can reveal insights into the oxidation state, chemical composition, and potential surface reactions of molybdenum-containing materials. Additionally, factors such as Coster-Kronig broadening and the presence of overlapping peaks from other elements (e.g., sulfur in MoS₂) must be considered for accurate interpretation. This makes XPS a powerful tool for studying the surface properties and chemical behaviour of molybdenum in various applications, from catalysis to electronic materials.

Figure 1: Mo metal XPS spectra(1)
As can be seen in figure 1, the peaks of Mo metal are asymmetric in shape, however the oxides will possess a symmetric shape.
Mo 3d overlaps with S 2s, so if modelling MoS2 materials, this intensity must be accounted for when modelling Mo states.
Not available
Not available
- Grim, Samuel O., and Luis J. Matienzo. “X-ray photoelectron spectroscopy of inorganic and organometallic compounds of molybdenum.” Inorganic chemistry 14.5 (1975): 1014-1018. Read it online here.
- Choi, J-G., and L. T. Thompson. “XPS study of as-prepared and reduced molybdenum oxides.” Applied surface science 93.2 (1996): 143-149. Read it online here.
- Spectra recorded by HarwellXPS
- Werfel, F. and E. Minni (1983). “Photoemission study of the electronic structure of Mo and Mo oxides.” Journal of Physics C: Solid State Physics 16(31): 6091. Read it online here.