Oxygen (Metal Oxides)
Doublet Separations
- No relevant non-S-orbital emissions
The Energies Listed are Binding Energies!
- O 1s: 530 eV
- O 2s: 20 eV
- O 2p: 8 eV
The Energies Listed are Binding Energies!
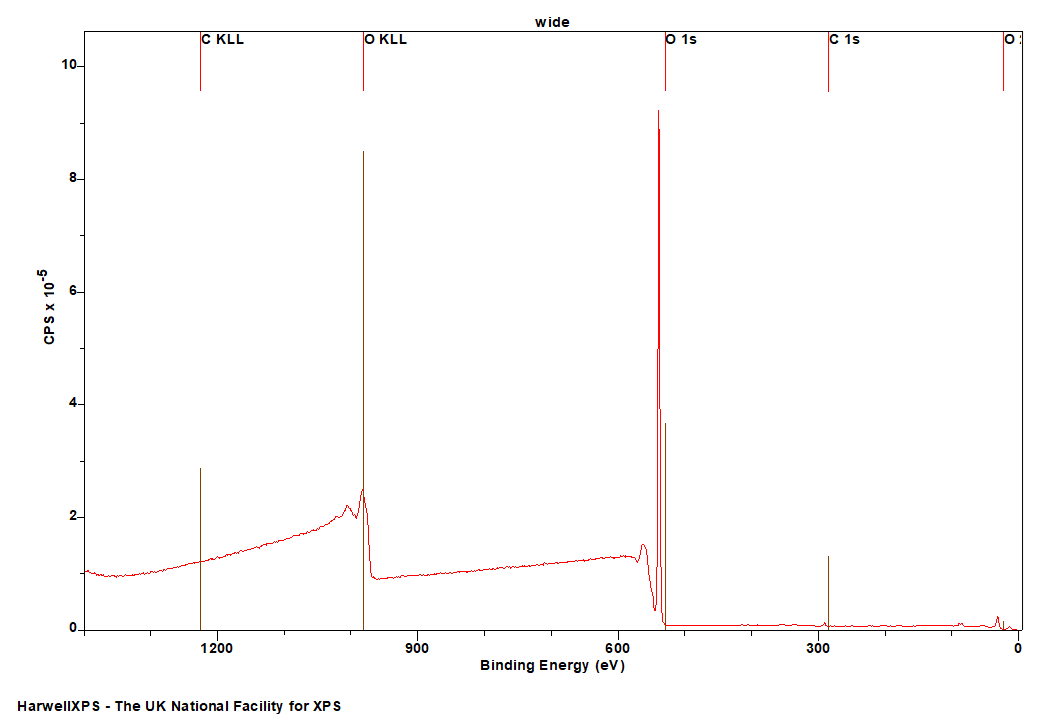
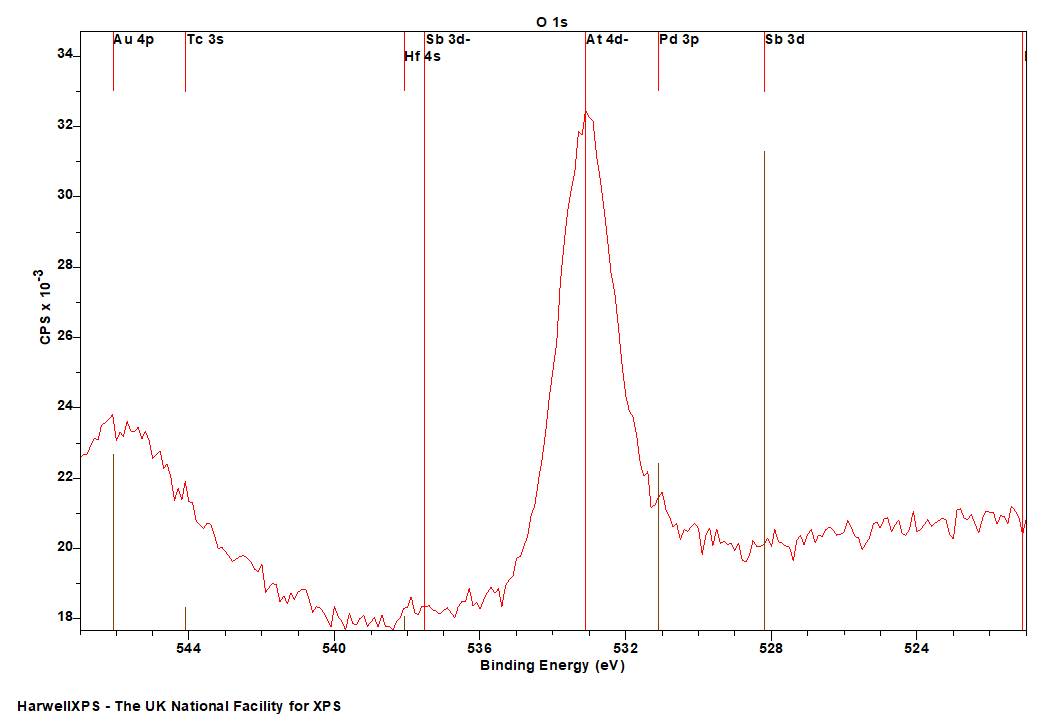
Overlaps for O 1s (primary emission)
- Na KLL (Al kα X-rays) (500 eV)
- V 2p (512 eV)
- Dy MNN (Al kα X-rays) (517 eV)
- Sb 3d (528 eV)
- Pd 3d (531 eV)
- At 4d (533 eV)
Energies listed are Kinetic Energies!
O KLL: ~ 505 eV
The Energies Listed are Binding Energies!
| Species | Binding energy / eV | Charge Ref | Ref |
| Ag2CO3 | 530.7 ± 0.1 | C (285 eV) | Ref |
| Ag2O | 529.3 ± 0.1 & 531.1 ± 0.1 | C (285 eV) | Ref |
| AgO | 528.6 ± 0.1 & 530.7 ± 0.1 | C (285 eV) | Ref |
| Al2O3 | 531 ± 0.1 | C (284.8 eV) | Ref |
| AlO(OH) | 531.2 ± 0.1 | C (284.8 eV) | Ref |
| Al(OH)3 | 531.2 ± 0.2 | C (285 eV) | Ref |
| AmOx | 529 | Pt 4f (71.3 eV) | Ref |
| As2O3 | 531.8 ± 0.25 | Au (84 eV) | Ref |
| Au2O3 | 530.2 | Au (84 eV) | Ref |
| Ba(OH)2 | 531.2 | Au (84 eV) | Ref |
| BaCO3 | 530.95 ± 0.15 | C (284.8 eV) | Ref |
| BaO | 530.8 ± 0.2 | (284.8 eV) | Ref |
| BaO2 | 530.8 | C (284.8 eV) | Ref |
| BeO | 531.6 ± 0.1 | C (285 eV) | Ref |
| Bi2O3 | 530.1 ± 0.2 | C (284.8 eV) | Ref |
| CdO | 528.6 | Au (83.8 eV) | Ref |
| Cd(OH)2 | 530.7 | Au (83.8 eV) | Ref |
| CdO2 | 530.3 | Au (83.8 eV) | Ref |
| CdCO3 | 531.2 | Au (83.8 eV) | Ref |
| Cr(OH)3 | 530.0 ± 0.1 | C 1s (285 eV) | Ref |
| Cr2O3 | 530.2 ± 0.1 | C 1s (285 eV) | Ref |
| CsOx (O2-) | 525.3 ± 0.1 | C 1s (284.8 eV) | Ref |
| CsOx (O2–) | 529.5 ± 0.2 | C 1s (284.8 eV) | Ref |
| CsOx (O22-) | 530.5 ± 0.1 | C 1s (284.8 eV) | Ref |
The Energies Listed are Binding Energies!
| Species | Binding energy / eV | Charge Ref | Ref |
| Li2O | 530.6 | Au 4f (83.8 eV) | Ref |
| LiOH | 533.6 | Au 4f (83.8 eV) | Ref |
| MgO | 529.6 | C (285 eV) | Ref |
| Mg(OH)2 | 531.3 | C (285 eV) | Ref |
| PbO | 528.9 | C 1s (284.6 eV) | Ref |
| Pb(OH)2 | 531 | C 1s (284.6 eV) | Ref |
| PbO2 | 529.2 | C 1s (285 eV) | Ref |
| Pb3O4 | 529.5 | C 1s (285 eV) | Ref |
| PtO2 | 531.6 | C 1s (285 eV) | Ref |
| Rh2O3 | 530.5 | C (285 eV) | Ref |
Oxygen spectra of metal oxide systems ranges from simple to highly complex, particularly in the case of mixed metal oxide systems. Often times the dominant signal may be attributed to the lattice oxygen – for simple systems such as SiO2 or TiO2 (Figure 1). These tend to be accompanied by a secondary signal at higher binding energy associated with surface hydroxyls.

Figure 1: Lattice O and surface hydroxyls of P-25 TiO2 and SiO2 nanospheres.1
Appreciation of the lattice peak relative to the hydroxyl may in som cases be tricky, with real surfaces rarely presenting themselves free from surface terminal groups. CryoXPS of liquid metal oxides however, presents the capability to isolate the M-O species free from additional complications, for the right system (Figure 2).
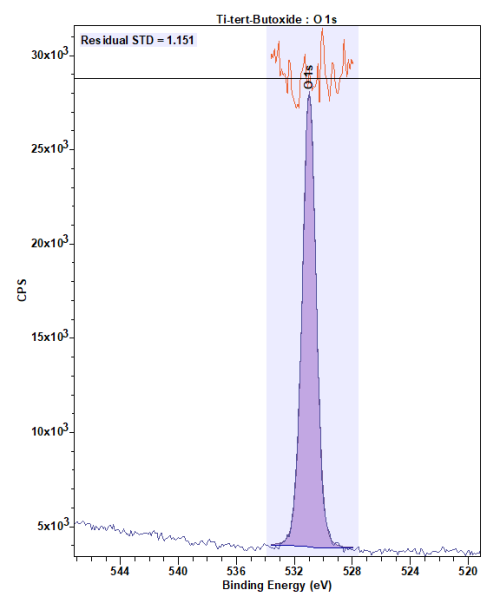
Figure 2: CryoXPS of Titanium tert-Butoxide1,2
Oxygen analysis of mixed metal oxides may prove advantageous when considering quantification analysis of inhomogeneous metal oxides – for example titania monolayers grown onto silica supports,3 since the two species have comparable kinetic energies rendering differing escape depths (of the Ti 2p and Si 2p core lines) a redundant factor when considering surface composition (Figure 3).

Figure 3: O 1s region for a Ti oxide overlayer on Si oxide support.1
Surface basicity
Analysis of the oxygen auger region may yield crucial information regarding surface basicity, particularly crucial when considering solid base catalysts. The auger parameter provides insight into the surface polarizability of the solid material, and hence may be correlated quantifiably with surface basicity (Figure 4).4
O 1s spectra can be used as one way of estimated material band gaps, albeit with some limitations, first recorded by Nichols et al for low-k organosilicate dielectrics.[5]
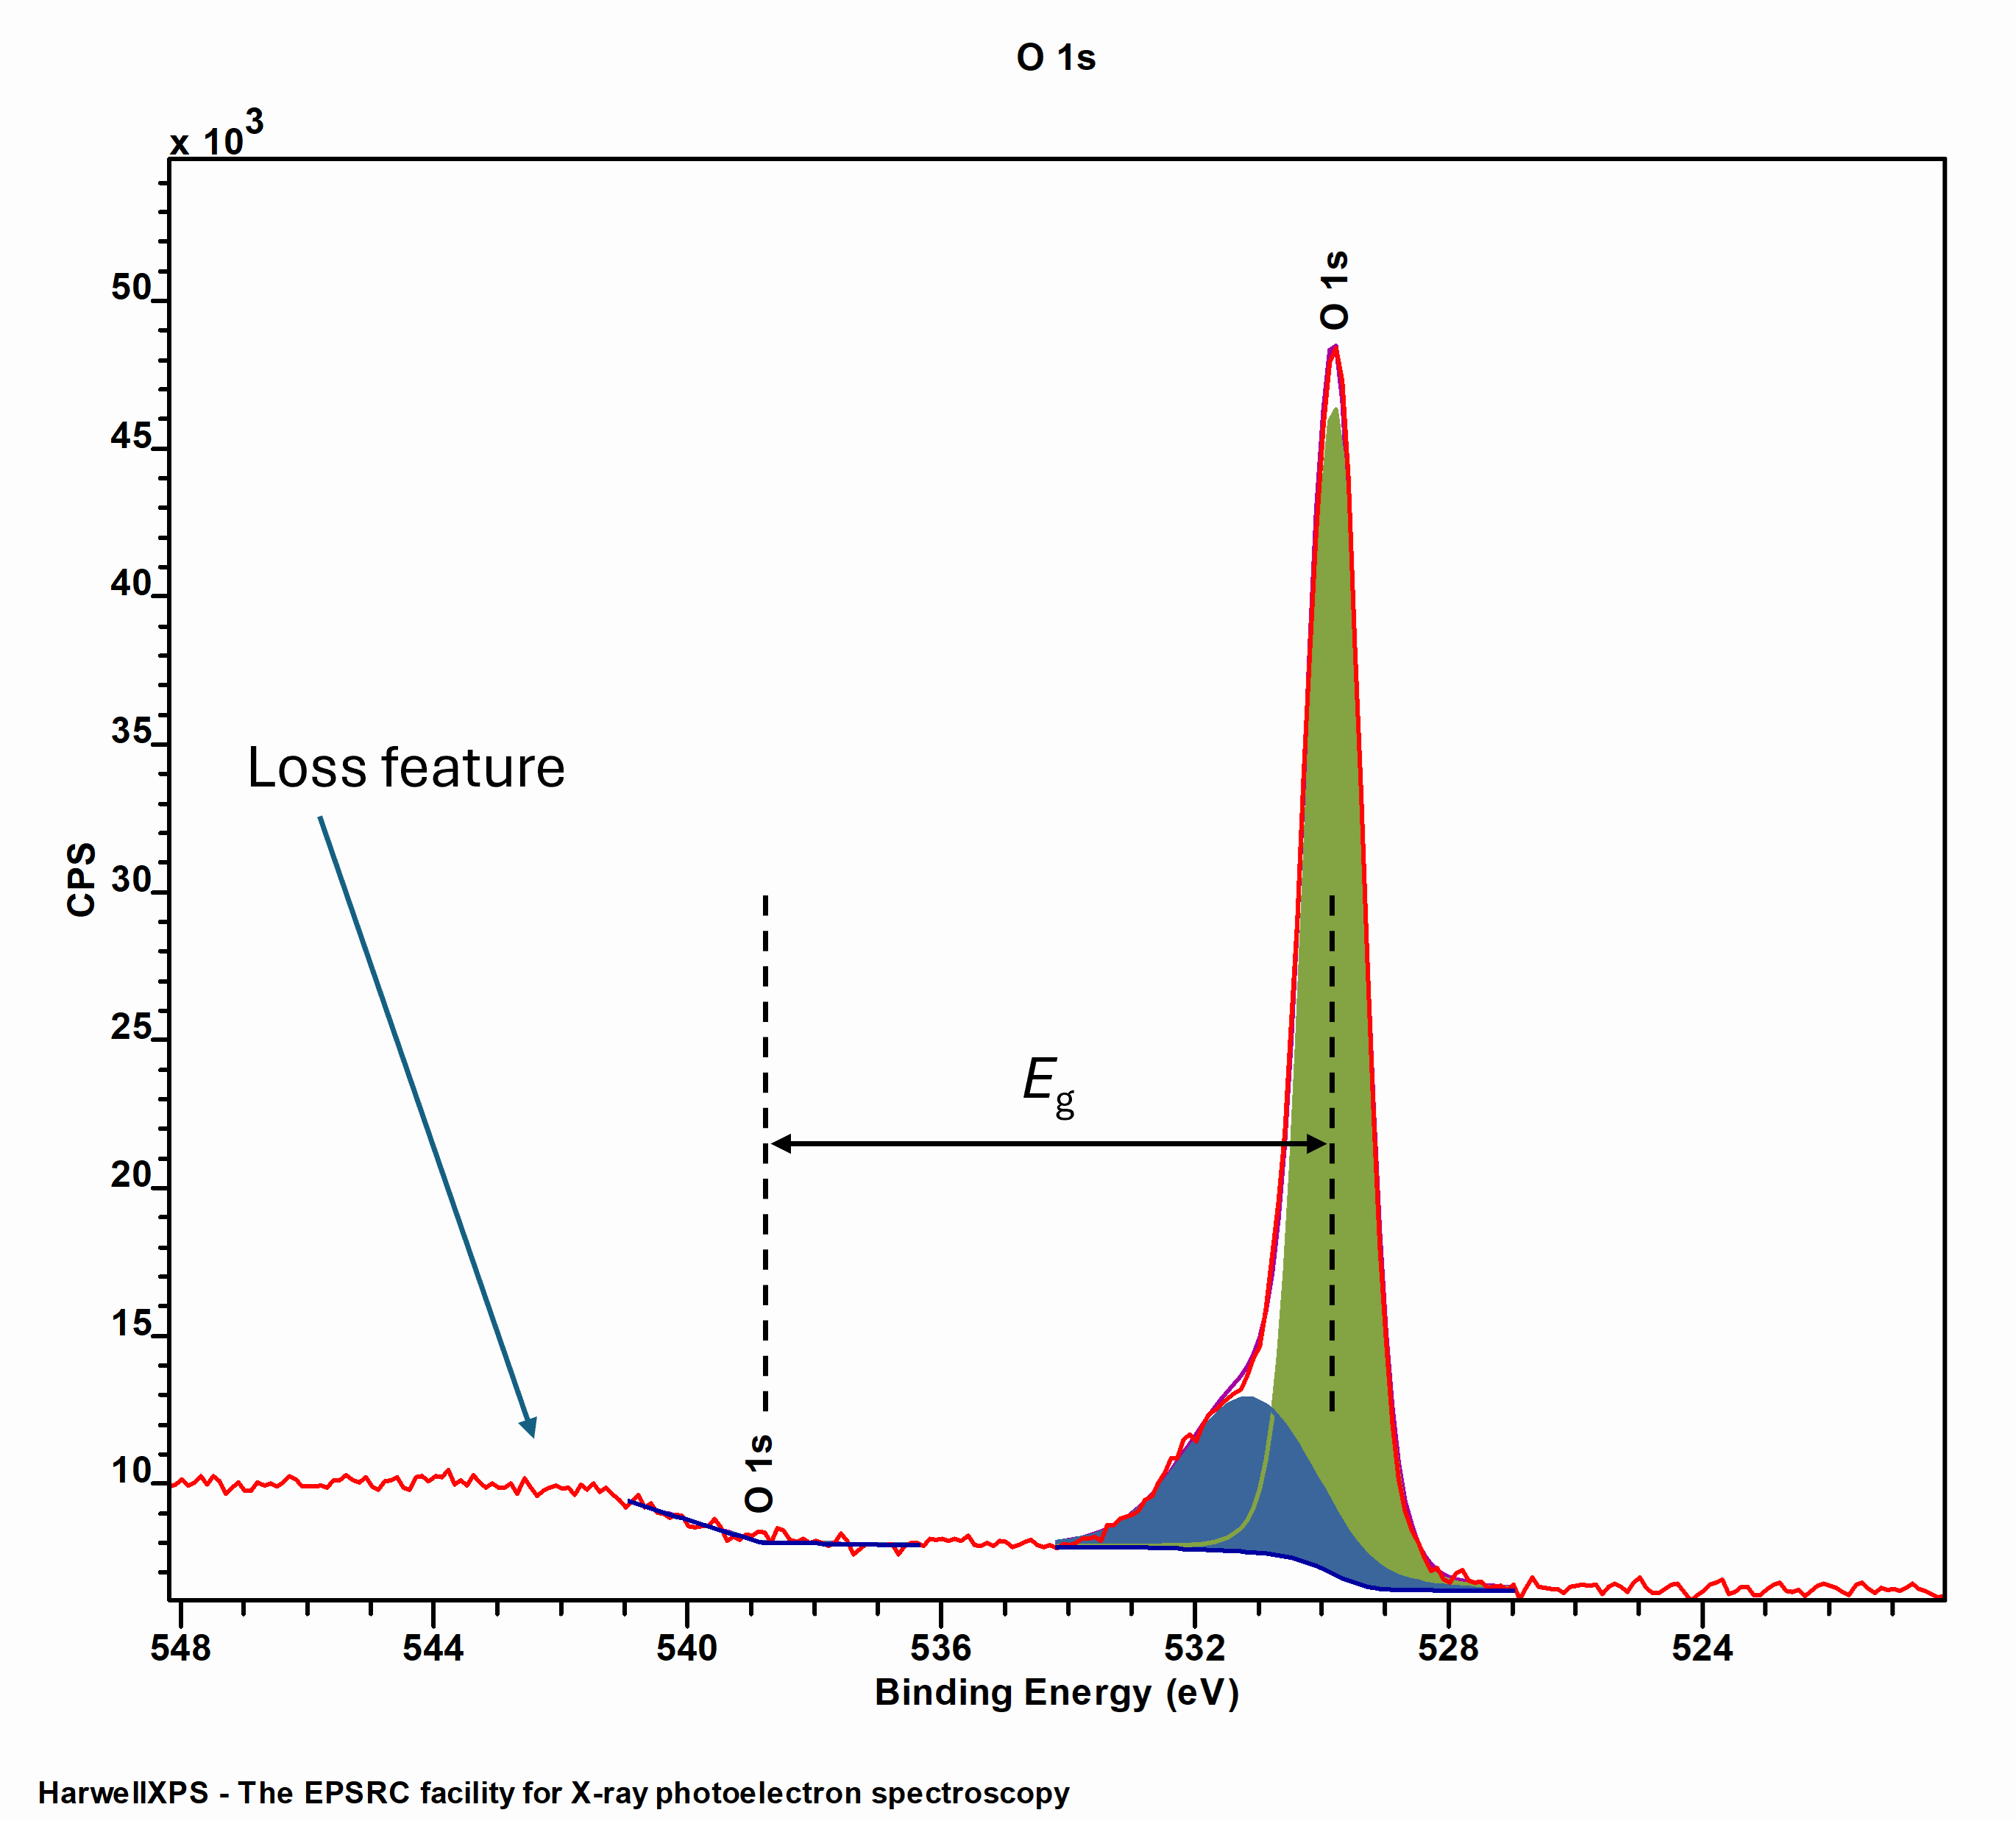
Measurement of a material band gap using the O 1s core emission and onset off loss structure
Since, this method has been used to study many materials, including alumina,[6] AlGa,[7] and HfO2.[8] It should, however, be noted that this method may not be applicable to small band gap materials, due to the natural line width of O 1s emissions, and potential formation of surface defects/hydroxyls resulting in a high energy shoulder.
It has become an unfortunately entrenched approach to attribute high energy photoemission intensity to the presence of oxygen vacancies in metal oxide, semiconductor systems. Simply put, a vacancy cannot produce a photoelectrons signal, because it is a lack of an atom – and therefore does not have electrons to emit! A number of recent works have tackled this problem in the literature (See, Morgan [9], Idriss [10], and Wang, Mueller and Crumlin [11]). It is of far more use to study the oxidation state of the metal component and determine vacancies through this lens.
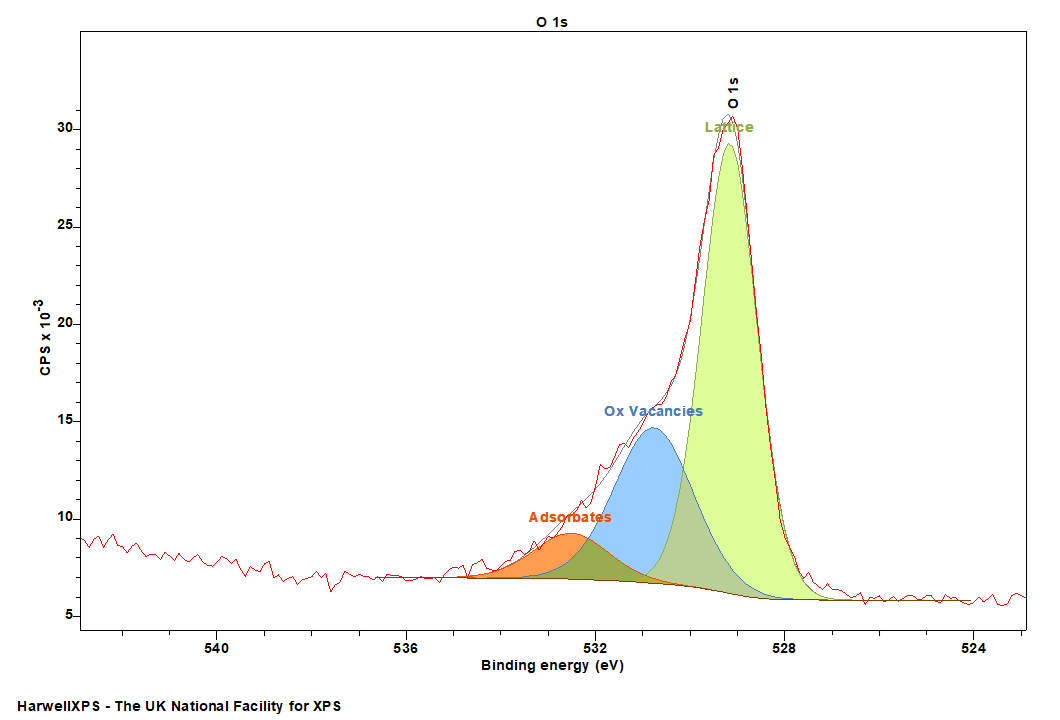
Now this is not to say that XPS may not be used in the inference of a changing vacancy content by analysis of an O 1s region, however a deep understanding of the surface is required, and of the possibly states that may form – and is still best performed alongside a complementary technique (e.g. EPR and FTIR) to ensure the model developed is applicable and accurate.
For example, in the case of TiOx – the presence of hydroxyls and adsorbates has been used to infer changing vacancy contents, and compared with VB, and metal core line XPS.[12] Frankcombe and Liu [13] have determined theoretically that such adsorbates on ZnO represent a more robust appreciation of the actual surface, compared to assignment as vacancies.
Not available
Not available
References
- Data acquired by HarwellXPS
- Isaacs, Mark A. “Low temperature XPS of sensitive molecules: Titanium butoxide photoelectron spectra.” Applied Surface Science Advances 18 (2023): 100467. Read it online here.
- Isaacs, Mark A., Brunella Barbero, Lee J. Durndell, Anthony C. Hilton, Luca Olivi, Christopher MA Parlett, Karen Wilson, and Adam F. Lee. “Tunable silver-functionalized porous frameworks for antibacterial applications.” Antibiotics 7, no. 3 (2018): 55. Read it online here.
- Montero, Janine M., Pratibha Gai, Karen Wilson, and Adam F. Lee. “Structure-sensitive biodiesel synthesis over MgO nanocrystals.” Green chemistry 11, no. 2 (2009): 265-268. Read it online here.
- Nichols, M. T., et al. “Measurement of bandgap energies in low-k organosilicates.” Journal of Applied Physics 115.9 (2014). Read it online here.
- Filatova, Elena O., and Aleksei S. Konashuk. “Interpretation of the changing the band gap of Al2O3 depending on its crystalline form: connection with different local symmetries.” The Journal of Physical Chemistry C 119.35 (2015): 20755-20761. Read it online here.
- Zhang, Fabi, et al. “Wide bandgap engineering of (AlGa) 2O3 films.” Applied Physics Letters 105.16 (2014). Read it online here.
- Martínez-Puente, M. A., et al. “ALD and PEALD deposition of HfO2 and its effects on the nature of oxygen vacancies.” Materials Science and Engineering: B 285 (2022): 115964. Read it online here.
- Morgan, David J. “Photoelectron spectroscopy of ceria: Reduction, quantification and the myth of the vacancy peak in XPS analysis.” Surface and Interface Analysis 55.11 (2023): 845-850. Read it online here.
- Idriss, Hicham. “On the wrong assignment of the XPS O1s signal at 531–532 eV attributed to oxygen vacancies in photo-and electro-catalysts for water splitting and other materials applications.” Surface Science 712 (2021): 121894. Read it online here.
- Wang, Jiayue, David N. Mueller, and Ethan J. Crumlin. “Recommended strategies for quantifying oxygen vacancies with X-ray photoelectron spectroscopy.” Journal of the European Ceramic Society (2024): 116709. Read it online here.
- Liccardo, Letizia, et al. “Surface defect engineering in colored TiO2 hollow spheres toward efficient photocatalysis.” Advanced Functional Materials 33.22 (2023): 2212486. Read it online here.
- Frankcombe, Terry J., and Yun Liu. “Interpretation of oxygen 1s X-ray photoelectron spectroscopy of ZnO.” Chemistry of Materials 35.14 (2023): 5468-5474. Read it online here.