XPS Pass Energy

Pass Energy Overview

Pass energy is the energy at which the photoelectrons travel the hemispherical analyser


Impacts

High pass energy = higher intensity, but lower energy resolution

Figure 1: Hemispherical analyser(1)

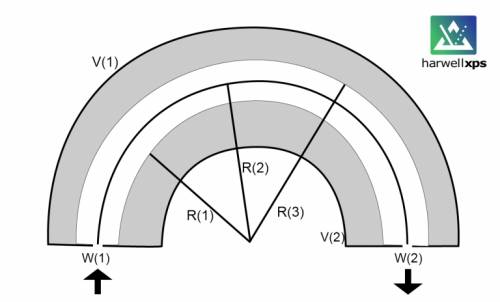
So here, we have 3 radii; R1 – the inner hemisphere, R2 – the centre of the hemisphere and R3 – the outer hemisphere. We also have a potential applied (V0) so that V1 on the outer hemisphere is negative and V2 is positive. Finally, we have slit widths – the entry slit, W1 and the exit slit, W2.

Note: R2 = (R1 + R3)/2

Electrons are retarded by the column and focused into the entry slit. The analyser is set to an energy, and any electrons which match this energy are refocused into the exit slit and detector, resulting in a signal. This energy is called the pass energy (EP). For example, if the pass energy is set to 20 eV, an electron travelling with a kinetic energy of 1000 eV would need to be slowed by 980 eV.

Energy is reduced as:

t = T – qVp

Where T = initial K.E., q = particle charge, Vp = decelerating voltage, t = resultant K.E.

For a given V0, only electrons of a specific EP may travel to the detector along R2.

Our resolution (ΔE) is dependant on pass energy (among other things) via the following relationship:

ΔE = EP . (W/2R2 + α2/2)

Where W is the slit width (W1 = W2) and α is the angle of acceptance.

Thus, for a higher pass energy, we observe poorer resolution (figure 2), though improved signal intensity.

As we can see in figure 2, when we switch between high and low pass energy we observe an enormous difference in the peak width. This limits the usefulness of high pass energy scans as we are less able to discern subtle shifts in the binding energy, or resolve multiple components within a spectral envelope (to the point that species with a small doublet separation such as S 2p, or Br 3d, may appear as a single peak only).


Figure 2: Intensity normalised spectra of Au foil using a pass energy of 160 (red) vs 20 (dark green) – energy offset for clarity

You must consider what information you require from your analysis when selecting a pass energy for a scan. Typically we would first split up our scan types into survey scans (or wide scans), and detailed scans (or region scans).


Surveys

  • Quantification of elemental contents
  • Identification of all signals present

Both of these objectives require high count rates – so we are best off selecting a high pass energy. This is typically in the range of 150-200 eV. The poor resolution of this negates the advantages of a smaller step size, and so these measurements will typically run on a large step size of about 1 eV.

Some experts, such as Vincent Fernandez,(2,3) would advocate the use of a lower pass energy (80-100 eV) and smaller step size (0.5 eV) in order to improve the accuracy of these scans. This setup has the clear advantage of improving background fittings around large background energy steps, and revealing initial chemistry insights – though at the cost of longer analysis times.


Regions

  • Specific surface chemistry
  • Electronic energy levels

Given the greater focus on resolving peak structure in region scans, a lower pass energy is required here. Typically 20-50 eV is used for region scans. While 20 eV is often preferrable, there may not be a very large difference between the energy resolution of 20 and slightly higher pass energies (e.g. 40) – measure the Fermi edge of a clean Ag foil to determine the energy resolution at the 2 pass energies and this can help make a decision on the best course of action (or a clean PTFE/PET sample if you are studying insulators so you can assess effect of charge neutraliser too).

If there is only a few % difference between the two pass energies and you are looking for low concentrations then measuring at a slightly higher pass energy may be the better option. If there is a large difference, or you are looking at very strong peaks, or peaks with very low separation – then 20 eV will be the better option.

Valence regions are often best obtained using a pass energy of 40/50 – given the low cross-sections of orbitals in this region.

References

  1. Omicron EA 125 Energy Analyser Manual
  2. Fernandez, Vincent, et al. “Surface science insight note: Optimizing XPS instrument performance for quantification of spectra.” Surface and Interface Analysis 56.7 (2024): 468-478. Read it online here.
  3. Richard-Plouet, Mireille, et al. “Recent Workshops on X-ray Photoelectron Spectroscopy (XPS) in Roscoff and Le Croisic, France, and an Upcoming XPS Workshop in South Wales, UK.” Read it online here.

Leave a comment