Tin
Doublet Separations
- Sn 3d: 8.5 eV
- Sn 3p: 41.9 eV
- Sn 4d: 1.05 eV
The Energies Listed are Binding Energies!
- Sn 3s: 884 eV
- Sn 3p: 715 eV
- Sn 3d: 485 eV
- Sn 4s: 137 eV
- Sn 4p: 89 eV
- Sn 4d: 24 eV
- Sn 5p: 1 eV
The Energies Listed are Binding Energies!
Sn is primarily analyzed via the 3d orbital
- Ru 3p (483 eV)
- Yb 4s (487 eV)
- W 4p (492 eV)
- Zn LMM (Al source) (495 eV)
- Ir 4p (495 eV)
- Rh 3p (496 eV)
Energies listed are Kinetic Energies!
Sn MNN: ~ 428 eV
Modified Auger Parameter: The modified Auger parameter (α’) can be used to analyze the chemical state of tin. This method relies on the observation of both photoelectrons (Sn 3d) and Auger electrons (Sn MNN) and is less sensitive to charging effects than binding energy analysis alone. As such it is advised to collect the Sn auger along with the 3d core line.(6)

Techniques such as correlation analysis, or auger analysis are very helpful in the understanding of Sn oxidation states.
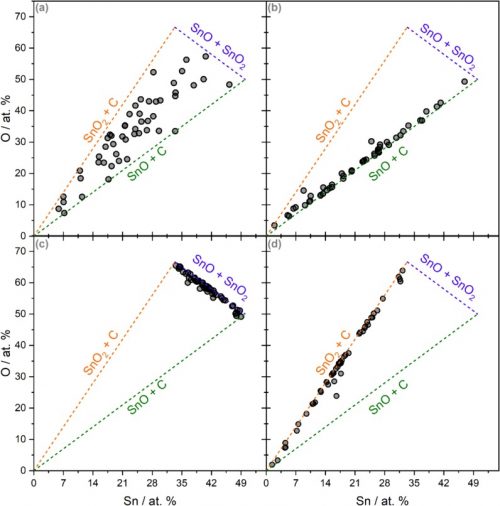
In the case of tin oxides, the Sn 3d peak does not exhibit a discernible chemical shift between SnO and SnO2. However, the oxidation states can be determined by considering the metal to oxygen stoichiometry, and correlation analysis provides a new viewpoint on this method. By analyzing the correlation between Sn and O, and incorporating a phase model, the average oxidation state of Sn can be determined at any point in a depth profile.
Not available
Not available
- Axnanda, Stephanus, Wei-Ping Zhou, and Michael G. White. “CO oxidation on nanostructured SnO x/Pt (111) surfaces: unique properties of reduced SnO x.” Physical Chemistry Chemical Physics 14.29 (2012): 10207-10214. Read it online here.
- Stranick, Michael A., and Anthony Moskwa. “SnO by XPS.” Surface Science Spectra 2.1 (1993): 45-49. Read it online here.
- Stranick, Michael A., and Anthony Moskwa. “SnO2 by XPS.” Surface Science Spectra 2.1 (1993): 50-54. Read it online here.
- Themlin, Jean-Marc, et al. “Characterization of tin oxides by x-ray-photoemission spectroscopy.” Physical Review B 46.4 (1992): 2460. Read it online here.
- Kövér, L., et al. “Electronic structure of tin oxides: High‐resolution study of XPS and Auger spectra.” Surface and interface analysis 23.7‐8 (1995): 461-466. Read it online here.
- Wieczorek, Alexander, et al. “Resolving Oxidation States and X–site Composition of Sn Perovskites through Auger Parameter Analysis in XPS.” Advanced Materials Interfaces 10.7 (2023): 2201828. Read it online here.
- Sexton, B. A., A. E. Hughes, and K. Foger. “An X-ray photoelectron spectroscopy and reaction study of Pt Sn catalysts.” Journal of Catalysis 88.2 (1984): 466-477. Read it online here.
- Axnanda, Stephanus, Wei-Ping Zhou, and Michael G. White. “CO oxidation on nanostructured SnO x/Pt (111) surfaces: unique properties of reduced SnO x.” Physical Chemistry Chemical Physics 14.29 (2012): 10207-10214. Read it online here.
- Domashevskaya, E. P., et al. “XPS and XANES studies of SnO x nanolayers.” Journal of Structural Chemistry 49 (2008): 80-91. Read it online here.
- Ansell, R. O., et al. “Quantitative use of the angular variation technique in studies of tin by X-ray photoelectron spectroscopy.” Journal of Electron Spectroscopy and Related Phenomena 11.3 (1977): 301-313. Read it online here.
- Bhatt, Prajna, et al. “Correlation analysis in X-ray photoemission spectroscopy.” Applied Surface Science 672 (2024): 160808. Read it online here.