XPS for Beginners
- XPS Course Fundamentals
- XPS Data Analysis
Welcome to this XPS course from HarwellXPS. Here we will go through the fundamentals of how the XPS technique works, through to best practices for data analysis, and onto how to use XPS in different ways and combine it with other techniques to get the most out of your science.
Throughout this course you will be provided with a series of videos, accompanying text, example datasets, problems and solutions to help you on your journey.
We start in part 1, with a look at the underlying principles of photoemission.
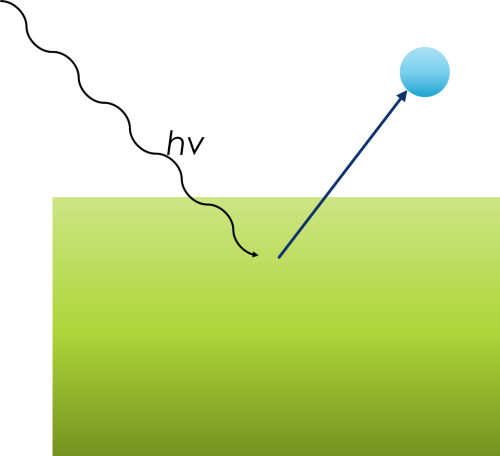
The photoelectric effect was first observed and studied by Heinrich Hertz, a German physicist, in 1887. Hertz’s experiments provided early evidence of the phenomenon, demonstrating that when ultraviolet light was shone onto a metal surface, it could cause the emission of electrons from the metal. However, at the time, the underlying mechanisms and the full significance of this discovery were not fully understood.
The detailed theoretical explanation and a deeper understanding of the photoelectric effect came later, in the early 20th century. Albert Einstein made a significant contribution to the field in 1905 when he proposed a groundbreaking theoretical framework to explain the photoelectric effect. Einstein’s work suggested that light consists of quantized packets of energy, which we now call photons. He used this concept to explain why the photoelectric effect depended on the frequency (or energy) of the incident light and not its intensity. This explanation marked a crucial step in the development of quantum mechanics and earned Einstein the Nobel Prize in Physics in 1921.
The equation is:
EK = hv – EB – Φ
- EK = Kinetic energy of released photoelectron
- hv = Energy of exciting radiation
- EB = Binding energy of released photoelectron
- φ = Work function
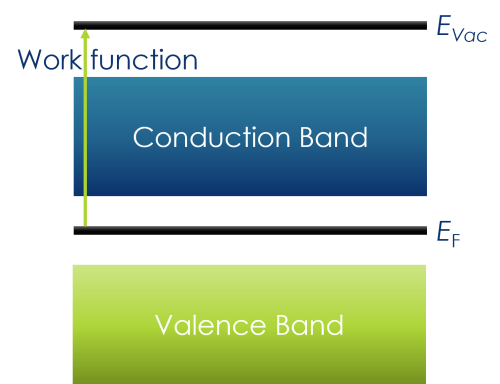
In solid state chemistry, the Fermi level is the highest electronic level when at absolute zero
Work function is the energy required to take an electron from EF to the vacuum level (EVac) – i.e. an electron at rest removed from the atom
In XPS, there is also an instrument work function – this will be covered later in the course
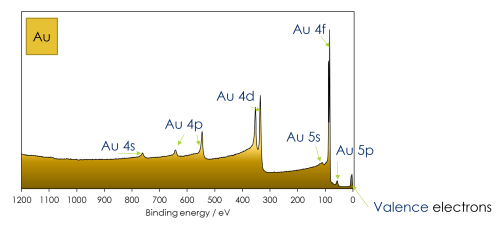
- Binding Energy (EB or BE) Axis: The x-axis of the spectrum is typically labeled in electronvolts (eV) and represents the binding energy of the emitted photoelectrons. Binding energy is the energy required to remove an electron from an atom or molecule within the material. The x-axis typically ranges from high binding energy (left side) to low binding energy (right side).
- Intensity (Counts or Intensity) Axis: The y-axis represents the intensity or counts of photoelectrons detected at each energy level. It quantifies the number of emitted electrons at each binding energy.
- Energy Regions: XPS spectra are typically divided into energy regions, each corresponding to a different type of electron transition. The main regions you’ll find in an XPS spectrum include:
- Core-Level Peaks: These are the most prominent features in the spectrum and represent electrons from the innermost, tightly bound electron shells of the atoms. Each element has characteristic core-level binding energies, and these peaks provide information about the chemical composition of the material.
- Valence Band: Beyond the core-level peaks, there is a region known as the valence band. It contains information about the electronic structure of the material, particularly the valence electrons involved in chemical bonding.
- Auger Transitions: Auger electron peaks result from Auger transitions in which an electron falls into a core-level hole created by the ejection of a core electron. More on these later.
- Peak Characteristics: For each core-level peak in the XPS spectrum, you can extract several key pieces of information:
- Binding Energy (BE): The position of the peak on the binding energy axis indicates the energy required to remove an electron from that specific atomic or molecular orbital. It can be used to identify the elements present in the sample.
- Peak Shape: The shape of the peak can provide information about the chemical state and bonding environment of the element. For example, the peak shape may be asymmetric, indicating chemical bonding or different chemical environments for the same element.
- Peak Intensity: The height or area under the peak provides information about the concentration of the element in the sample.
- Shifts and Splitting: XPS spectra can also show shifts in binding energies or splitting of peaks, which can be indicative of chemical interactions, chemical states, or different oxidation states of an element.
- Background: The background signal in the XPS spectrum is usually subtracted to enhance the visibility of the peaks. It represents the inelastic scattering of electrons and other background noise.
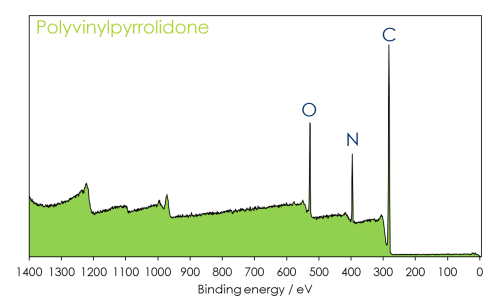
So what are we observing?
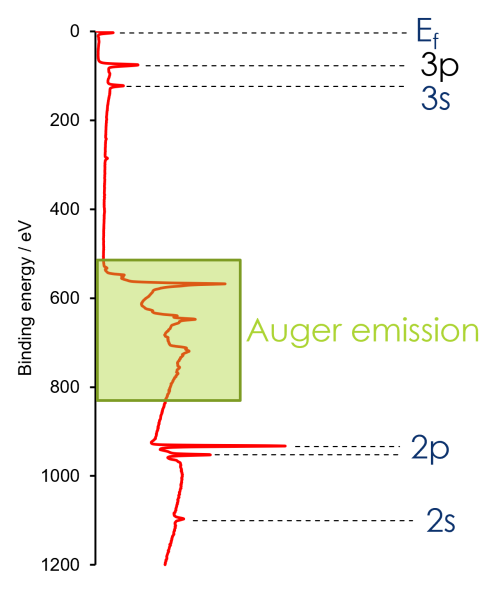
- In XPS we are looking at the core levels closest to valence orbitals, because we use relatively soft X-rays (typically <1500 eV) to excite our photoelectrons.
- Lighter elements produce fewer peaks, since there are fewer overall orbitals within the atom.
- If we want to see deeper lying orbitals in heavier atoms, then we will need to use harder X-ray sources (HAXPES).
You can think of XPS spectra like an energy level diagram
Electrons located closer to the core bound by a higher binding energy
In reality, we are not studying a ground state but an excited state (atom following photoemission) – but energy level model a useful exercise to understanding the general spectrum
There are a number of factors affecting XPS peak intensity:
- X-ray flux (J)
- Elemental concentration (C)
- Photoionisation cross-section (σ)
- Spectrometer angular acceptance (ζ)
- Spectrometer transmission function (T)
- Inelastic mean free path (λ)
These combine to form the following expression:
I = JCσζTλ
Spectrometer transmission function and Spectrometer angular acceptance are instrumental factors that can be considered constants for the purposes of this section.
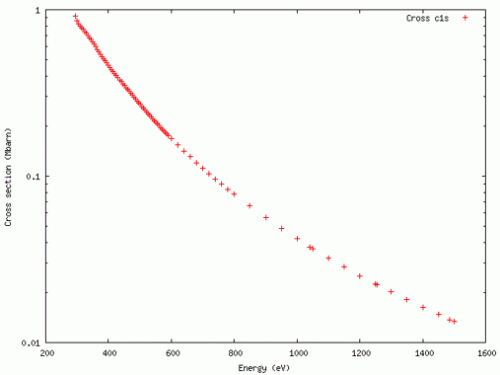
Photoionization cross sections, often denoted as σ(w), are a fundamental concept in quantum mechanics and atomic physics. They describe the probability that an incident photon will ionize an atom or molecule when it interacts with it. In other words, photoionization cross sections quantify how likely it is for a photon to remove an electron from an atom or molecule, creating a positively charged ion.
The photoionization cross section is defined as the probability per unit area that a photon with a particular energy will ionize an atom or molecule. It is usually expressed in units of square centimeters (cm²).
The photoionization cross section is a function of photon energy. This means that for different photon energies, you will have different cross sections. At certain photon energies, the cross section may have pronounced peaks corresponding to specific electron energy levels or resonances.
The photoionization cross section depends on the electron configuration of the atom or molecule being ionized. Different electron orbitals (e.g., 1s, 2s, 2p, etc.) have different ionization energies and thus different cross sections. Moreover, the angular distribution of emitted photoelectrons can vary depending on the initial electron state.
Of course, you also need enough energy to excite the electron in the first place! This is a core principle of the photoelectric effect! For example, plotting the cross sections for Ni 2p using the Elettra sincotrone photoionisation cross-section calculator – you can see that there are no cross-sections below the ionisation energy of Ni 2p electrons.

3 factors affect the width and overall distribution of electron energies around a core emission:
- X-ray energy spread (Γxray) Gaussian
- Spectrometer broadening (Γspec) Gaussian
- Intrinsic line-width (Γinstrinic) Lorentzian
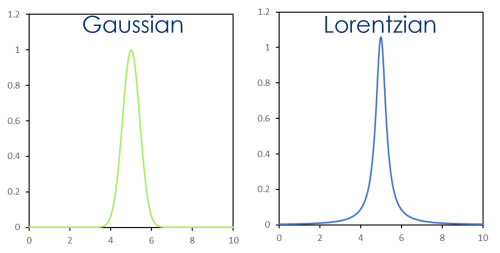
FWHM = (Γxray2 + Γspec2 + Γintrinsic2)1/2
Γintrinsic = h/τ = 4.1 x 10⁻¹⁵/ τ eV
τ = core-hole lifetime (typically 10-13 – 10-15 s)
Intrinsic line-widths: 0.04 – 4 eV
Cu 3d
Incorrect
Cu 3d electrons are in the valence shell, and therefore the furthest away from the atomic nucleus. This means the pull they experience from the atom centre is much less than for other orbitals – since not only are they further away, but they also have lower energy electronic orbitals shielding them from the positively charge nucleus.
Cu 3p
Incorrect
Cu 3p sits between Cu 3s and Cu 4s/3d in our energy diagram – and as such is relatively near to the valence orbital shell. This means it will not take so much energy to remove these electrons and the binding energy will be relatively low.
Cu 2p
Incorrect
Copper 2p is the most widely analysed orbital in XPS, due to the high intensity (Check the photoionisation cross sections), however it is NOT the highest in binding energy of these orbitals. Cu 2s is the most deeply lying core orbital and as such has a higher binding energy than Cu 2p.
Cu 2p
Correct!
Yes! Cu 2s is the most deeply lying orbital of these options and as such has the highest binding energy. In fact, Cu 2s is the highest energy orbital we can see using standard XPS (Al ka X-rays), and if we want to see the Cu 1s orbital (8.98 keV) we must use a higher energy X-ray source such as gallium or a synchrotron!
Decreases
Incorrect
Think about the photoelectric effect equation:
Ek = hv – Eb – φ
If we change our incoming X-ray energy (hv) it has no effect on the binding energy of the electron, only the kinetic energy of the outgoing photoelectron.
Stays the same
Correct!
Yes!
Ek = hv – Eb – φ
If we change our incoming X-ray energy (hv) it has no effect on the binding energy of the electron, only the kinetic energy of the outgoing photoelectron.
Increases
Incorrect
Think about the photoelectric effect equation:
Ek = hv – Eb – φ
If we change our incoming X-ray energy (hv) it has no effect on the binding energy of the electron, only the kinetic energy of the outgoing photoelectron.
Carbon
Incorrect
Carbon only has 1s orbitals below the valence shell, so we only see a single peak (C 1s). Not, we can actually see C 2s and C 2p peaks at very low binding energies – but these tend to be very difficult to extract any information from due to complexity from hybridisation and a very low signal due to low cross-sections.
Calcium
Incorrect
Calcium exhibits signals from Ca 2p, Ca 2s, Ca 3s and Ca 3p in a standard (Al ka) XPS spectrum. Using higher energy sources we can also find the Ca 1s orbital, giving a total of 5.
Iridium
Correct!
Using a standard Al ka X-ray source, we can excite 4f, 4d, 4p and 4s orbitals from Iridium. Using higher energy sources we can excite all orbitals below these also, meaning 3d, 3p, 3s, 2p, 2s and 1s. This gives us a total of 9 orbitals!
Ni 2p
Incorrect
Uh oh! 500 eV is not enough energy to excite Ni 2p electrons!
Ni 3p
Correct!
Yes! Plotting the three orbitals on the calculator you can see the photoionisation cross-section for Ni 3p is indeed the highest.
Ni 3s
Incorrect
Plotting the three orbitals together you’ll see the photoionisation cross-section for Ni 3s is lower than Ni 3p.